This page provides a comprehensive overview of the global Almond market, combining production, trade, and price data in a clear and structured format. It features a world map illustrating the distribution of production volumes, charts showing total global output over the last twelve years, and the share of world production by country. Additional graphs highlight the production volumes of the three leading producer countries as well as the top 20 importing and exporting nations. A crop calendar outlines planting and harvest periods, while current price charts reflect recent market developments.
The page is designed for stakeholders in agricultural trading, processing, logistics, market analysis, and procurement. It answers key market questions related to global supply structures, trade flows, seasonal patterns, and price dynamics in the international Almond market.
Latest Almond Market News

Iran Conflict Could Trigger Prolonged Commodity Rally — Here’s What Traders Must Know
Iran Conflict Could Trigger Prolonged Commodity Rally — Here’s What Traders Must Know CMB News | Market Analysis | March 2026 The military escalation involving […]
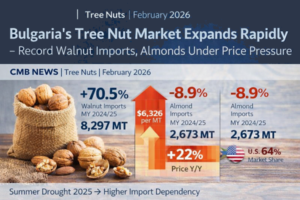
Bulgaria’s Tree Nut Market Expands Rapidly – Record Walnut Imports, Almonds Under Price Pressure
Bulgaria’s Tree Nut Market Expands Rapidly – Record Walnut Imports, Almonds Under Price Pressure CMB News | Tree Nuts | February 2026 Bulgaria’s tree nut […]
Bulgaria Tree Nut Market Expands as U.S. Maintains Leadership and Global Pistachio Output Rebounds
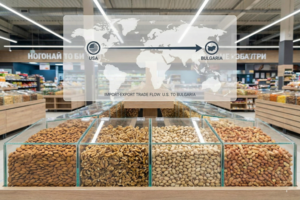
Bulgarian Tree Nut Market Hits Record Growth Bulgaria’s tree nut market expanded rapidly in MY 2024/25, driven by stronger retail demand, tourism growth, and improved […]
Click here for more Almond Market News & Prices | Global Supply, Demand & Outlook

Interactive World Map of Global Almonds Production
Please hover over a country to view its production figures.
Global Production Volumes in Recent Years
Please hover over a year to view the corresponding production figures.
Almonds Production by Country and Share of Total Global Production
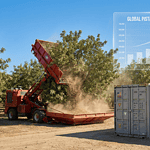
Production Volumes of the Three Largest Producing Countries
Please hover over a country to view the corresponding import volumes.
Import Volumes of the Largest Almond Importers
Please hover over a country to view the corresponding export volumes.
Export Volumes of the Largest Almonds Exporters
Please hover over a data point to view the corresponding production figures.
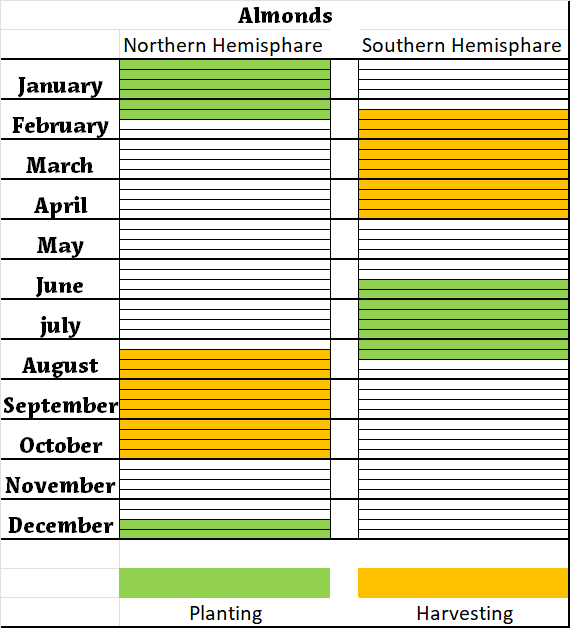
Planting and Harvest Periods of Almonds
Price Charts
Please hover over a date to view the corresponding price point.
US Almond kernel imports into the EU in kg
| wdt_ID | Years | 2020 | 2021 | 2022 | 2023 | 2024 |
|---|---|---|---|---|---|---|
| 1 | Austria | 234,839.00 | 136,320.00 | 257,489.00 | 58,073.00 | 247,890.00 |
| 2 | Belgium | 8,163,373.00 | 10,030,121.00 | 9,268,941.00 | 7,363,125.00 | 487,140.00 |
| 3 | Bulgaria | 1,225,953.00 | 1,159,879.00 | 1,154,716.00 | 1,138,736.00 | 27,430.00 |
| 4 | Croatia | 675,201.00 | 889,962.00 | 789,720.00 | 1,579,697.00 | 40,400.00 |
| 5 | Cyprus | 597,468.00 | 469,065.00 | 537,594.00 | 518,497.00 | 17,080.00 |
| 6 | Czech Republic | 1,134,219.00 | 1,052,346.00 | 893,194.00 | 837,639.00 | 21,220.00 |
| 7 | Denmark | 3,607,587.00 | 4,450,178.00 | 4,648,313.00 | 4,461,403.00 | 236,000.00 |
| 8 | Estonia | 122,470.00 | 209,010.00 | 212,736.00 | 83,008.00 | 2,260.00 |
| 9 | Finland | 199,580.00 | 99,790.00 | 79,845.00 | 49.00 | 3,280.00 |
| 10 | France | 12,270,180.00 | 13,093,570.00 | 9,156,512.00 | 10,265,097.00 | 1,131,530.00 |
| 11 | Germany | 58,633,637.00 | 63,136,738.00 | 54,370,757.00 | 53,532,478.00 | 818,020.00 |
| 12 | Greece | 5,667,290.00 | 5,832,622.00 | 5,431,003.00 | 5,091,231.00 | 170,360.00 |
| 13 | Hungary | 383,884.00 | 348,779.00 | 305,407.00 | 323,366.00 | 14,200.00 |
| 14 | Ireland | 288,206.00 | 376,838.00 | 396,780.00 | 292,254.00 | 19,480.00 |
| 15 | Italy | 37,516,033.00 | 39,888,776.00 | 36,308,842.00 | 37,984,586.00 | 2,312,810.00 |
| 16 | Latvia | 256,355.00 | 383,969.00 | 318,180.00 | 215,697.00 | 45,180.00 |
| 17 | Lithuania | 1,015,564.00 | 1,419,658.00 | 1,135,761.00 | 1,526,470.00 | 8,370.00 |
| 18 | Luxembourg | 0.00 | 1.00 | 0.00 | 3.00 | 23,230.00 |
| 19 | Malta | 52,163.00 | 90,097.00 | 73,684.00 | 74,816.00 | 5,380.00 |
| 20 | Netherlands | 32,424,681.00 | 37,623,163.00 | 39,185,653.00 | 38,131,124.00 | 175,960.00 |
| 21 | Poland | 1,877,164.00 | 2,675,589.00 | 2,254,253.00 | 2,893,603.00 | 72,190.00 |
| 22 | Portugal | 756,822.00 | 575,017.00 | 674,287.00 | 319,340.00 | 681,300.00 |
| 23 | Romania | 181,729.00 | 272,155.00 | 278,510.00 | 239,224.00 | 180,140.00 |
| 24 | Slovakia | 179,623.00 | 339,152.00 | 19,958.00 | 9,979.00 | 109,040.00 |
| 25 | Slovenia | 3.00 | 0.00 | 44.00 | 10.00 | 43,310.00 |
| 26 | Spain | 87,187,311.00 | 92,371,269.00 | 96,644,760.00 | 81,137,073.00 | 9,446,340.00 |
| 27 | Sweden | 3,322,159.00 | 2,660,068.00 | 3,073,576.00 | 2,300,000.00 | 257,660.00 |
| 28 | EU27 | 257,973,494.00 | 279,584,132.00 | 267,470,515.00 | 250,376,578.00 | 16,597,200.00 |
| 29 |
Related posts:
 Azerbaijan’s Almond Exports Boom: Volumes Triple Amid Shifting Trade Patterns
 Almonds in Flux: Local Decline, Global Imports & the Changing Orchard Landscape
 Almonds in South Kashmir: Structural Decline, Climate Pressures & Global Competition
 Global Pistachio Production Falls 8% as U.S. Output Surges to Record 713,000 MT
 Almonds Market: Strong Forward Sales Amid Sluggish Shipments & Supply Concerns