This page provides a comprehensive overview of the global Almond market, combining production, trade, and price data in a clear and structured format. It features a world map illustrating the distribution of production volumes, charts showing total global output over the last twelve years, and the share of world production by country. Additional graphs highlight the production volumes of the three leading producer countries as well as the top 20 importing and exporting nations. A crop calendar outlines planting and harvest periods, while current price charts reflect recent market developments.
The page is designed for stakeholders in agricultural trading, processing, logistics, market analysis, and procurement. It answers key market questions related to global supply structures, trade flows, seasonal patterns, and price dynamics in the international Almond market.
Latest Almond Market News

杏仁市场保持坚挺,出口领先,天气支持
西班牙和美国的杏仁仁价格基本稳定,紧张的有机供应和强劲的出口需求目前防止任何有意义的价格下跌。短期价格风险略微偏向上行,特别是优质的西班牙和有机美国等级,因为出货强劲,主要生长地区的天气也很良好。 全球杏仁贸易进入2025/26市场年度的下半年,加利福尼亚出口领先于上个季度,而西班牙的供应结构性增加,但在欧洲得到了良好的消化。最新数据显示,加利福尼亚3月出货量同比增长两位数,主要受到对欧洲和亚洲的出口需求的推动,这在国内美国需求偏软的情况下帮助减少库存。(nationalnutgrower.com) 在西班牙,生产基础的显著改善和强劲的欧盟内部贸易流,支撑了西班牙来源作为价格参考的角色,而安达卢西亚的温暖稳定天气和加利福尼亚的优越条件在近期内支持作物发展。 [cmb_offer ids=639,636,83] 📈 价格与差异 2026年4月17日的指示性仁价格换算为欧元(约1美元=0.93欧元),显示西班牙(FOB马德里)和美国(FAS/FOB华盛顿D.C.)的市场周环比持平。西班牙常规瓦伦西亚工业类型价格聚集在中间的5欧元/kg左右,而马尔科纳和华拉则明显溢价。美国卡梅尔SSR价格略高于主流西班牙工业价格,非帕瑞尔和有机产品则有进一步溢价。 来源产品等级/类型条款价格(EUR/kg)周环比变化 美国杏仁仁卡梅尔SSR 18/20FAS≈ 6.25稳定 美国杏仁仁卡梅尔SSR 20/22FAS≈ 6.20稳定 美国杏仁仁非帕瑞尔 27/30,有机FOB≈ 8.70稳定 西班牙杏仁仁瓦伦西亚 10/12FOB≈ 5.20稳定 西班牙杏仁仁瓦伦西亚 12/14FOB≈ 5.15稳定 西班牙杏仁仁瓦伦西亚 […]
Os Mercados de Amêndoas Mantêm-se Firmes à Medida que as Exportações Lideram e o Clima Permanece Favorável
Os preços do núcleo de amêndoas na Espanha e nos EUA estão amplamente estáveis, com a oferta orgânica restrita e a firme demanda por exportação […]
Рынки миндаля остаются стабильными, поскольку экспорт ведет, а погода поддерживает
Цены на миндаль в Испании и США в целом стабильны, при этом ограниченное предложение органического миндаля и устойчивый экспортный спрос не позволяют снизиться ценам. Краткосрочные […]
Click here for more Almond Market News & Prices | Global Supply, Demand & Outlook

Interactive World Map of Global Almonds Production
Please hover over a country to view its production figures.
There was an issue displaying the chart. Please edit the chart in the admin area for more details.Global Production Volumes in Recent Years
Please hover over a year to view the corresponding production figures.
Almonds Production by Country and Share of Total Global Production
There was an issue displaying the chart. Please edit the chart in the admin area for more details.Production Volumes of the Three Largest Producing Countries
Please hover over a country to view the corresponding import volumes.
Import Volumes of the Largest Almond Importers
Please hover over a country to view the corresponding export volumes.
There was an issue displaying the chart. Please edit the chart in the admin area for more details.Export Volumes of the Largest Almonds Exporters
Please hover over a data point to view the corresponding production figures.
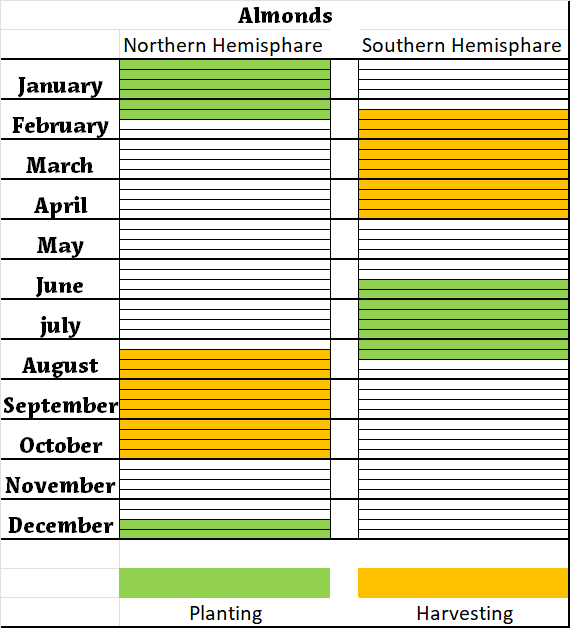
There was an issue displaying the chart. Please edit the chart in the admin area for more details.Planting and Harvest Periods of Almonds
Price Charts
Please hover over a date to view the corresponding price point.
US Almond kernel imports into the EU in kg
| wdt_ID | Years | 2020 | 2021 | 2022 | 2023 | 2024 |
|---|---|---|---|---|---|---|
| 1 | Austria | 234,839.00 | 136,320.00 | 257,489.00 | 58,073.00 | 247,890.00 |
| 2 | Belgium | 8,163,373.00 | 10,030,121.00 | 9,268,941.00 | 7,363,125.00 | 487,140.00 |
| 3 | Bulgaria | 1,225,953.00 | 1,159,879.00 | 1,154,716.00 | 1,138,736.00 | 27,430.00 |
| 4 | Croatia | 675,201.00 | 889,962.00 | 789,720.00 | 1,579,697.00 | 40,400.00 |
| 5 | Cyprus | 597,468.00 | 469,065.00 | 537,594.00 | 518,497.00 | 17,080.00 |
| 6 | Czech Republic | 1,134,219.00 | 1,052,346.00 | 893,194.00 | 837,639.00 | 21,220.00 |
| 7 | Denmark | 3,607,587.00 | 4,450,178.00 | 4,648,313.00 | 4,461,403.00 | 236,000.00 |
| 8 | Estonia | 122,470.00 | 209,010.00 | 212,736.00 | 83,008.00 | 2,260.00 |
| 9 | Finland | 199,580.00 | 99,790.00 | 79,845.00 | 49.00 | 3,280.00 |
| 10 | France | 12,270,180.00 | 13,093,570.00 | 9,156,512.00 | 10,265,097.00 | 1,131,530.00 |
| 11 | Germany | 58,633,637.00 | 63,136,738.00 | 54,370,757.00 | 53,532,478.00 | 818,020.00 |
| 12 | Greece | 5,667,290.00 | 5,832,622.00 | 5,431,003.00 | 5,091,231.00 | 170,360.00 |
| 13 | Hungary | 383,884.00 | 348,779.00 | 305,407.00 | 323,366.00 | 14,200.00 |
| 14 | Ireland | 288,206.00 | 376,838.00 | 396,780.00 | 292,254.00 | 19,480.00 |
| 15 | Italy | 37,516,033.00 | 39,888,776.00 | 36,308,842.00 | 37,984,586.00 | 2,312,810.00 |
| 16 | Latvia | 256,355.00 | 383,969.00 | 318,180.00 | 215,697.00 | 45,180.00 |
| 17 | Lithuania | 1,015,564.00 | 1,419,658.00 | 1,135,761.00 | 1,526,470.00 | 8,370.00 |
| 18 | Luxembourg | 0.00 | 1.00 | 0.00 | 3.00 | 23,230.00 |
| 19 | Malta | 52,163.00 | 90,097.00 | 73,684.00 | 74,816.00 | 5,380.00 |
| 20 | Netherlands | 32,424,681.00 | 37,623,163.00 | 39,185,653.00 | 38,131,124.00 | 175,960.00 |
| 21 | Poland | 1,877,164.00 | 2,675,589.00 | 2,254,253.00 | 2,893,603.00 | 72,190.00 |
| 22 | Portugal | 756,822.00 | 575,017.00 | 674,287.00 | 319,340.00 | 681,300.00 |
| 23 | Romania | 181,729.00 | 272,155.00 | 278,510.00 | 239,224.00 | 180,140.00 |
| 24 | Slovakia | 179,623.00 | 339,152.00 | 19,958.00 | 9,979.00 | 109,040.00 |
| 25 | Slovenia | 3.00 | 0.00 | 44.00 | 10.00 | 43,310.00 |
| 26 | Spain | 87,187,311.00 | 92,371,269.00 | 96,644,760.00 | 81,137,073.00 | 9,446,340.00 |
| 27 | Sweden | 3,322,159.00 | 2,660,068.00 | 3,073,576.00 | 2,300,000.00 | 257,660.00 |
| 28 | EU27 | 257,973,494.00 | 279,584,132.00 | 267,470,515.00 | 250,376,578.00 | 16,597,200.00 |
| 29 |
[cmb_chart ids=619]