This page provides a comprehensive overview of the global Almond market, combining production, trade, and price data in a clear and structured format. It features a world map illustrating the distribution of production volumes, charts showing total global output over the last twelve years, and the share of world production by country. Additional graphs highlight the production volumes of the three leading producer countries as well as the top 20 importing and exporting nations. A crop calendar outlines planting and harvest periods, while current price charts reflect recent market developments.
The page is designed for stakeholders in agricultural trading, processing, logistics, market analysis, and procurement. It answers key market questions related to global supply structures, trade flows, seasonal patterns, and price dynamics in the international Almond market.
Latest Almond Market News
因印度需求减弱,杏仁面临季节性压力
由于印度的主要批发市场因节后需求疲软和囤货商获利了结而修正,杏仁价格面临轻微下行压力,全球基准价格总体保持稳健但沉重。 印度的季节性需求低迷和囤货商的加速抛售正在压制加州杏仁价格进入亚洲,为欧洲和全球买家在加州的五月作物预估前创造了短期相对价格稳定的窗口。 📈 价格与市场快照 在德里批发市场,加州杏仁仁价格大约下滑 ₹300–₹700 每 40 公斤,约为 ₹23,200–₹23,300 每 40 公斤,相当于现行汇率下的约 €6.20–€6.30 每公斤。用于糖果的切片和漂白杏仁仁价格下滑至大约 ₹810–₹815 每公斤,或约 €8.70–€8.80 每公斤. 整个带壳的加州杏仁以类似比例走软,确认了各品类普遍修正的趋势。 其他优质坚果尤其是松子和干枣的平行走软确认了这一调整是行业范围内的,而非特定于杏仁的。示范性出口报价显示,加州杏仁仁(Carmel SSR,18/20 和 20/22)的价格在 €6.65–€6.70 […]
Миндали под сезонным давлением, так как спрос в Индии ослабевает
Цены на миндаль находятся под умеренным давлением, так как ключевые оптовые рынки Индии корректируются на фоне слабого постпраздничного спроса и фиксации прибыли складчиков, в то […]
Amêndoas sob pressão sazonal à medida que a demanda indiana suaviza
Os preços das amêndoas estão sob leve pressão de baixa à medida que os principais mercados atacadistas da Índia se corrigem devido à fraca demanda […]
Click here for more Almond Market News & Prices | Global Supply, Demand & Outlook
Interactive World Map of Global Almonds Production
Please hover over a country to view its production figures.
There was an issue displaying the chart. Please edit the chart in the admin area for more details.Global Production Volumes in Recent Years
Please hover over a year to view the corresponding production figures.
Almonds Production by Country and Share of Total Global Production
There was an issue displaying the chart. Please edit the chart in the admin area for more details.Production Volumes of the Three Largest Producing Countries
Please hover over a country to view the corresponding import volumes.
Import Volumes of the Largest Almond Importers
Please hover over a country to view the corresponding export volumes.
There was an issue displaying the chart. Please edit the chart in the admin area for more details.Export Volumes of the Largest Almonds Exporters
Please hover over a data point to view the corresponding production figures.
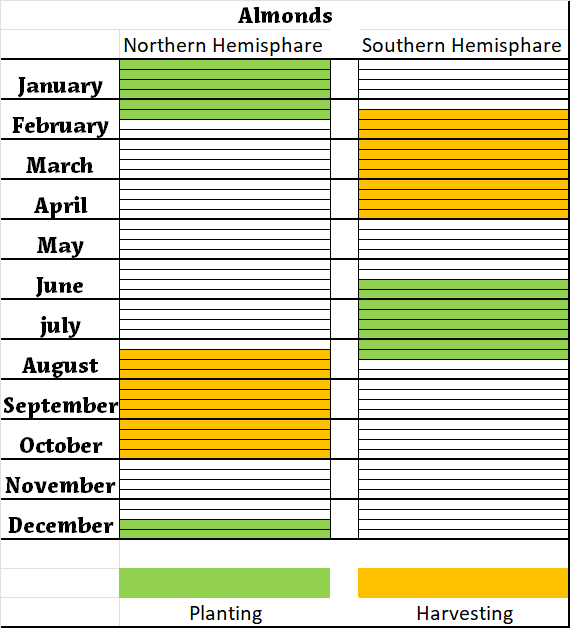
There was an issue displaying the chart. Please edit the chart in the admin area for more details.Planting and Harvest Periods of Almonds
Price Charts
Please hover over a date to view the corresponding price point.
US Almond kernel imports into the EU in kg
| wdt_ID | Years | 2020 | 2021 | 2022 | 2023 | 2024 |
|---|---|---|---|---|---|---|
| 1 | Austria | 234,839.00 | 136,320.00 | 257,489.00 | 58,073.00 | 247,890.00 |
| 2 | Belgium | 8,163,373.00 | 10,030,121.00 | 9,268,941.00 | 7,363,125.00 | 487,140.00 |
| 3 | Bulgaria | 1,225,953.00 | 1,159,879.00 | 1,154,716.00 | 1,138,736.00 | 27,430.00 |
| 4 | Croatia | 675,201.00 | 889,962.00 | 789,720.00 | 1,579,697.00 | 40,400.00 |
| 5 | Cyprus | 597,468.00 | 469,065.00 | 537,594.00 | 518,497.00 | 17,080.00 |
| 6 | Czech Republic | 1,134,219.00 | 1,052,346.00 | 893,194.00 | 837,639.00 | 21,220.00 |
| 7 | Denmark | 3,607,587.00 | 4,450,178.00 | 4,648,313.00 | 4,461,403.00 | 236,000.00 |
| 8 | Estonia | 122,470.00 | 209,010.00 | 212,736.00 | 83,008.00 | 2,260.00 |
| 9 | Finland | 199,580.00 | 99,790.00 | 79,845.00 | 49.00 | 3,280.00 |
| 10 | France | 12,270,180.00 | 13,093,570.00 | 9,156,512.00 | 10,265,097.00 | 1,131,530.00 |
| 11 | Germany | 58,633,637.00 | 63,136,738.00 | 54,370,757.00 | 53,532,478.00 | 818,020.00 |
| 12 | Greece | 5,667,290.00 | 5,832,622.00 | 5,431,003.00 | 5,091,231.00 | 170,360.00 |
| 13 | Hungary | 383,884.00 | 348,779.00 | 305,407.00 | 323,366.00 | 14,200.00 |
| 14 | Ireland | 288,206.00 | 376,838.00 | 396,780.00 | 292,254.00 | 19,480.00 |
| 15 | Italy | 37,516,033.00 | 39,888,776.00 | 36,308,842.00 | 37,984,586.00 | 2,312,810.00 |
| 16 | Latvia | 256,355.00 | 383,969.00 | 318,180.00 | 215,697.00 | 45,180.00 |
| 17 | Lithuania | 1,015,564.00 | 1,419,658.00 | 1,135,761.00 | 1,526,470.00 | 8,370.00 |
| 18 | Luxembourg | 0.00 | 1.00 | 0.00 | 3.00 | 23,230.00 |
| 19 | Malta | 52,163.00 | 90,097.00 | 73,684.00 | 74,816.00 | 5,380.00 |
| 20 | Netherlands | 32,424,681.00 | 37,623,163.00 | 39,185,653.00 | 38,131,124.00 | 175,960.00 |
| 21 | Poland | 1,877,164.00 | 2,675,589.00 | 2,254,253.00 | 2,893,603.00 | 72,190.00 |
| 22 | Portugal | 756,822.00 | 575,017.00 | 674,287.00 | 319,340.00 | 681,300.00 |
| 23 | Romania | 181,729.00 | 272,155.00 | 278,510.00 | 239,224.00 | 180,140.00 |
| 24 | Slovakia | 179,623.00 | 339,152.00 | 19,958.00 | 9,979.00 | 109,040.00 |
| 25 | Slovenia | 3.00 | 0.00 | 44.00 | 10.00 | 43,310.00 |
| 26 | Spain | 87,187,311.00 | 92,371,269.00 | 96,644,760.00 | 81,137,073.00 | 9,446,340.00 |
| 27 | Sweden | 3,322,159.00 | 2,660,068.00 | 3,073,576.00 | 2,300,000.00 | 257,660.00 |
| 28 | EU27 | 257,973,494.00 | 279,584,132.00 | 267,470,515.00 | 250,376,578.00 | 16,597,200.00 |
| 29 |