This page provides a comprehensive overview of the global Almond market, combining production, trade, and price data in a clear and structured format. It features a world map illustrating the distribution of production volumes, charts showing total global output over the last twelve years, and the share of world production by country. Additional graphs highlight the production volumes of the three leading producer countries as well as the top 20 importing and exporting nations. A crop calendar outlines planting and harvest periods, while current price charts reflect recent market developments.
The page is designed for stakeholders in agricultural trading, processing, logistics, market analysis, and procurement. It answers key market questions related to global supply structures, trade flows, seasonal patterns, and price dynamics in the international Almond market.
Latest Almond Market News

尽管印度需求疲软,进口成本坚挺,杏仁市场回落
由于需求减弱,印度主要批发市场的杏仁价格正在回落。尽管更弱的卢比导致的更高进口成本提供了结构性底线,但短期展望表明市场将软化并维持在区间内,除非出现明确的需求或与作物相关的催化剂。 本周,印度德里的干果市场已转为买方市场。加州杏仁仁价格下滑约0.08至0.09欧元/千克(约合10印度卢比/千克),现约在8.20至8.30欧元/千克,受到消费者和机构需求疲软以及库存商积极出售的影响。这一调整广泛出现在优质坚果中,表明这是一个以需求驱动的阶段,而不是突发的供给冲击。考虑到印度对美国来源供应的高度依赖以及今年卢比贬值约4.5%,进口成本仍然偏高,但这并未阻止短期价格回落。对于欧洲和其他国际买家来说,目前印度交易的杏仁软化提供了战术机会,尽管基本面尚未支持持久的牛市阶段。 📈 价格与区域信号 在德里的批发干果市场,加州杏仁仁——作为进口杏仁的基准——在周二下跌了约10印度卢比/千克,经过外汇换算后约在8.20至8.30欧元/千克。绝对值的下降虽然适度,但由于这是一个清晰的优质坚果复合体,包括核桃和其他进口坚果,购买支持的明显丧失,因此显得引人注目。 来自主要出口地的前瞻性价格信号也略显疲软。最近来自华盛顿特区的美国杏仁仁(Carmel SSR)的报价在过去一周小幅下滑约1-1.5%,标志性价格约为标准等级6.70至6.80欧元/千克FAS,有机Nonpareil类型接近9.35欧元/千克FOB。西班牙的Marcona和Valencia来源显示出类似的小幅周环比下滑,通常低0.5-1.0%,确认了温和受压的全球气氛,而不是剧烈的抛售。 来源 / 类型 规格 地点 / 条件 当前价格 (EUR/kg) 1周变化 美国杏仁仁 Carmel SSR 18/20 华盛顿特区, FAS ≈ 6.75 […]

Рынок миндаля ослабевает из-за слабого спроса в Индии, несмотря на высокие цены на импорт
Цены на миндаль снижаются на ключевом оптовом рынке Индии, так как спрос ослабевает, даже несмотря на высокие затраты на импорт из-за ослабления рупии, которые создают […]

Mercado de Amêndoas Enfraquece com Demanda Fraca da Índia Apesar de Custos Elevados de Importação
Os preços das amêndoas estão caindo no principal mercado atacadista da Índia, à medida que a demanda se enfraquece, mesmo que os maiores custos de […]
Click here for more Almond Market News & Prices | Global Supply, Demand & Outlook

Interactive World Map of Global Almonds Production
Please hover over a country to view its production figures.
There was an issue displaying the chart. Please edit the chart in the admin area for more details.Global Production Volumes in Recent Years
Please hover over a year to view the corresponding production figures.
Almonds Production by Country and Share of Total Global Production
There was an issue displaying the chart. Please edit the chart in the admin area for more details.Production Volumes of the Three Largest Producing Countries
Please hover over a country to view the corresponding import volumes.
Import Volumes of the Largest Almond Importers
Please hover over a country to view the corresponding export volumes.
There was an issue displaying the chart. Please edit the chart in the admin area for more details.Export Volumes of the Largest Almonds Exporters
Please hover over a data point to view the corresponding production figures.
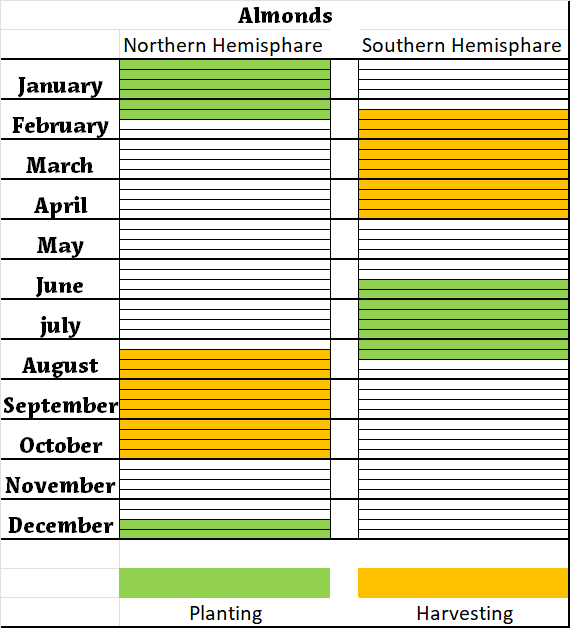
There was an issue displaying the chart. Please edit the chart in the admin area for more details.Planting and Harvest Periods of Almonds
Price Charts
Please hover over a date to view the corresponding price point.
US Almond kernel imports into the EU in kg
| wdt_ID | Years | 2020 | 2021 | 2022 | 2023 | 2024 |
|---|---|---|---|---|---|---|
| 1 | Austria | 234,839.00 | 136,320.00 | 257,489.00 | 58,073.00 | 247,890.00 |
| 2 | Belgium | 8,163,373.00 | 10,030,121.00 | 9,268,941.00 | 7,363,125.00 | 487,140.00 |
| 3 | Bulgaria | 1,225,953.00 | 1,159,879.00 | 1,154,716.00 | 1,138,736.00 | 27,430.00 |
| 4 | Croatia | 675,201.00 | 889,962.00 | 789,720.00 | 1,579,697.00 | 40,400.00 |
| 5 | Cyprus | 597,468.00 | 469,065.00 | 537,594.00 | 518,497.00 | 17,080.00 |
| 6 | Czech Republic | 1,134,219.00 | 1,052,346.00 | 893,194.00 | 837,639.00 | 21,220.00 |
| 7 | Denmark | 3,607,587.00 | 4,450,178.00 | 4,648,313.00 | 4,461,403.00 | 236,000.00 |
| 8 | Estonia | 122,470.00 | 209,010.00 | 212,736.00 | 83,008.00 | 2,260.00 |
| 9 | Finland | 199,580.00 | 99,790.00 | 79,845.00 | 49.00 | 3,280.00 |
| 10 | France | 12,270,180.00 | 13,093,570.00 | 9,156,512.00 | 10,265,097.00 | 1,131,530.00 |
| 11 | Germany | 58,633,637.00 | 63,136,738.00 | 54,370,757.00 | 53,532,478.00 | 818,020.00 |
| 12 | Greece | 5,667,290.00 | 5,832,622.00 | 5,431,003.00 | 5,091,231.00 | 170,360.00 |
| 13 | Hungary | 383,884.00 | 348,779.00 | 305,407.00 | 323,366.00 | 14,200.00 |
| 14 | Ireland | 288,206.00 | 376,838.00 | 396,780.00 | 292,254.00 | 19,480.00 |
| 15 | Italy | 37,516,033.00 | 39,888,776.00 | 36,308,842.00 | 37,984,586.00 | 2,312,810.00 |
| 16 | Latvia | 256,355.00 | 383,969.00 | 318,180.00 | 215,697.00 | 45,180.00 |
| 17 | Lithuania | 1,015,564.00 | 1,419,658.00 | 1,135,761.00 | 1,526,470.00 | 8,370.00 |
| 18 | Luxembourg | 0.00 | 1.00 | 0.00 | 3.00 | 23,230.00 |
| 19 | Malta | 52,163.00 | 90,097.00 | 73,684.00 | 74,816.00 | 5,380.00 |
| 20 | Netherlands | 32,424,681.00 | 37,623,163.00 | 39,185,653.00 | 38,131,124.00 | 175,960.00 |
| 21 | Poland | 1,877,164.00 | 2,675,589.00 | 2,254,253.00 | 2,893,603.00 | 72,190.00 |
| 22 | Portugal | 756,822.00 | 575,017.00 | 674,287.00 | 319,340.00 | 681,300.00 |
| 23 | Romania | 181,729.00 | 272,155.00 | 278,510.00 | 239,224.00 | 180,140.00 |
| 24 | Slovakia | 179,623.00 | 339,152.00 | 19,958.00 | 9,979.00 | 109,040.00 |
| 25 | Slovenia | 3.00 | 0.00 | 44.00 | 10.00 | 43,310.00 |
| 26 | Spain | 87,187,311.00 | 92,371,269.00 | 96,644,760.00 | 81,137,073.00 | 9,446,340.00 |
| 27 | Sweden | 3,322,159.00 | 2,660,068.00 | 3,073,576.00 | 2,300,000.00 | 257,660.00 |
| 28 | EU27 | 257,973,494.00 | 279,584,132.00 | 267,470,515.00 | 250,376,578.00 | 16,597,200.00 |
| 29 |