This page provides a comprehensive overview of the global Almond market, combining production, trade, and price data in a clear and structured format. It features a world map illustrating the distribution of production volumes, charts showing total global output over the last twelve years, and the share of world production by country. Additional graphs highlight the production volumes of the three leading producer countries as well as the top 20 importing and exporting nations. A crop calendar outlines planting and harvest periods, while current price charts reflect recent market developments.
The page is designed for stakeholders in agricultural trading, processing, logistics, market analysis, and procurement. It answers key market questions related to global supply structures, trade flows, seasonal patterns, and price dynamics in the international Almond market.
Latest Almond Market News
Almonds Market Frozen by Middle East Shipping Disruptions: Prices in Limbo
Almond shipments to the United Arab Emirates are currently facing one of the most significant operational disruptions in recent memory. Intensifying shipping issues across the […]

Almonds Market Update: Middle East Shipping Delays Squeeze UAE Supply, Support Prices
The global almond market is facing significant turbulence as shipping disruptions in the Middle East delay critical shipments to the UAE, a major import and […]

U.S. Retailers Struggle With Shifting Tariffs – Food Commodity Markets Also Affected
U.S. Retailers Struggle With Shifting Tariffs – Food Commodity Markets Also Affected CMB News | Trade & Food Commodity Markets | March 2026 U.S. retailers […]
Click here for more Almond Market News & Prices | Global Supply, Demand & Outlook

Interactive World Map of Global Almonds Production
Please hover over a country to view its production figures.
Global Production Volumes in Recent Years
Please hover over a year to view the corresponding production figures.
Almonds Production by Country and Share of Total Global Production
Production Volumes of the Three Largest Producing Countries
Please hover over a country to view the corresponding import volumes.
Import Volumes of the Largest Almond Importers
Please hover over a country to view the corresponding export volumes.
Export Volumes of the Largest Almonds Exporters
Please hover over a data point to view the corresponding production figures.
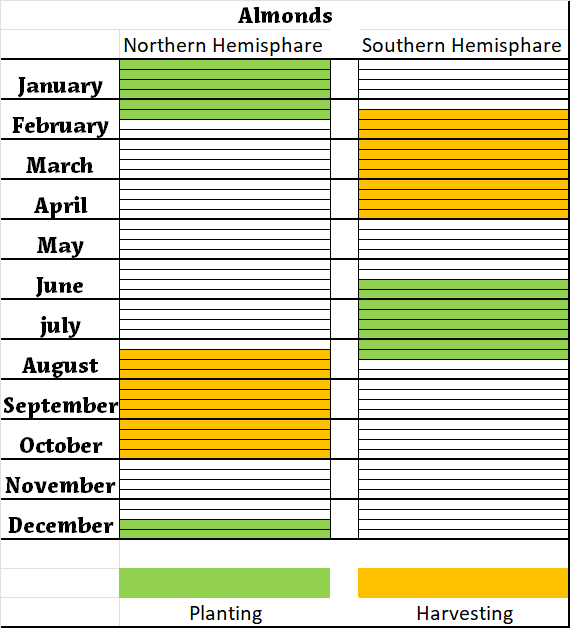
Planting and Harvest Periods of Almonds
Price Charts
Please hover over a date to view the corresponding price point.
US Almond kernel imports into the EU in kg
| wdt_ID | Years | 2020 | 2021 | 2022 | 2023 | 2024 |
|---|---|---|---|---|---|---|
| 1 | Austria | 234,839.00 | 136,320.00 | 257,489.00 | 58,073.00 | 247,890.00 |
| 2 | Belgium | 8,163,373.00 | 10,030,121.00 | 9,268,941.00 | 7,363,125.00 | 487,140.00 |
| 3 | Bulgaria | 1,225,953.00 | 1,159,879.00 | 1,154,716.00 | 1,138,736.00 | 27,430.00 |
| 4 | Croatia | 675,201.00 | 889,962.00 | 789,720.00 | 1,579,697.00 | 40,400.00 |
| 5 | Cyprus | 597,468.00 | 469,065.00 | 537,594.00 | 518,497.00 | 17,080.00 |
| 6 | Czech Republic | 1,134,219.00 | 1,052,346.00 | 893,194.00 | 837,639.00 | 21,220.00 |
| 7 | Denmark | 3,607,587.00 | 4,450,178.00 | 4,648,313.00 | 4,461,403.00 | 236,000.00 |
| 8 | Estonia | 122,470.00 | 209,010.00 | 212,736.00 | 83,008.00 | 2,260.00 |
| 9 | Finland | 199,580.00 | 99,790.00 | 79,845.00 | 49.00 | 3,280.00 |
| 10 | France | 12,270,180.00 | 13,093,570.00 | 9,156,512.00 | 10,265,097.00 | 1,131,530.00 |
| 11 | Germany | 58,633,637.00 | 63,136,738.00 | 54,370,757.00 | 53,532,478.00 | 818,020.00 |
| 12 | Greece | 5,667,290.00 | 5,832,622.00 | 5,431,003.00 | 5,091,231.00 | 170,360.00 |
| 13 | Hungary | 383,884.00 | 348,779.00 | 305,407.00 | 323,366.00 | 14,200.00 |
| 14 | Ireland | 288,206.00 | 376,838.00 | 396,780.00 | 292,254.00 | 19,480.00 |
| 15 | Italy | 37,516,033.00 | 39,888,776.00 | 36,308,842.00 | 37,984,586.00 | 2,312,810.00 |
| 16 | Latvia | 256,355.00 | 383,969.00 | 318,180.00 | 215,697.00 | 45,180.00 |
| 17 | Lithuania | 1,015,564.00 | 1,419,658.00 | 1,135,761.00 | 1,526,470.00 | 8,370.00 |
| 18 | Luxembourg | 0.00 | 1.00 | 0.00 | 3.00 | 23,230.00 |
| 19 | Malta | 52,163.00 | 90,097.00 | 73,684.00 | 74,816.00 | 5,380.00 |
| 20 | Netherlands | 32,424,681.00 | 37,623,163.00 | 39,185,653.00 | 38,131,124.00 | 175,960.00 |
| 21 | Poland | 1,877,164.00 | 2,675,589.00 | 2,254,253.00 | 2,893,603.00 | 72,190.00 |
| 22 | Portugal | 756,822.00 | 575,017.00 | 674,287.00 | 319,340.00 | 681,300.00 |
| 23 | Romania | 181,729.00 | 272,155.00 | 278,510.00 | 239,224.00 | 180,140.00 |
| 24 | Slovakia | 179,623.00 | 339,152.00 | 19,958.00 | 9,979.00 | 109,040.00 |
| 25 | Slovenia | 3.00 | 0.00 | 44.00 | 10.00 | 43,310.00 |
| 26 | Spain | 87,187,311.00 | 92,371,269.00 | 96,644,760.00 | 81,137,073.00 | 9,446,340.00 |
| 27 | Sweden | 3,322,159.00 | 2,660,068.00 | 3,073,576.00 | 2,300,000.00 | 257,660.00 |
| 28 | EU27 | 257,973,494.00 | 279,584,132.00 | 267,470,515.00 | 250,376,578.00 | 16,597,200.00 |
| 29 |