

This page provides a comprehensive overview of the global Sorghum market, combining production, trade, and price data in a clear and structured format. It features a world map illustrating the distribution of production volumes, charts showing total global output over the last twelve years, and the share of world production by country. Additional graphs highlight the production volumes of the three leading producer countries as well as the top 20 importing and exporting nations. A crop calendar outlines planting and harvest periods, while current price charts reflect recent market developments.
The page is designed for stakeholders in agricultural trading, processing, logistics, market analysis, and procurement. It answers key market questions related to global supply structures, trade flows, seasonal patterns, and price dynamics in the international Sorghum market.
Latest Sorghum Market News
Sorghum Market Analysis: Tight Ukrainian Supply Sets the Pace, Corn Prices In the Lead
The current global sorghum market remains remarkably stable, with Ukrainian farmers playing only a minor role in shaping international price developments. Despite Ukraine's agricultural might, […]

Sorghum Outlook 2026: Stability in Ukraine, Upside Potential as Wheat & Corn Rally
At the start of 2026, the Ukrainian sorghum market is marked by a notable sense of equilibrium. Sorghum prices remain steady at around 12,500 UAH/t […]
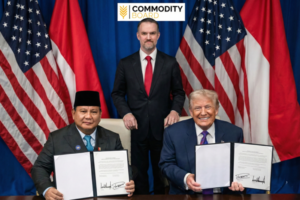
US–Indonesia Trade Deal Opens Tariff-Free Channel for Corn, Sorghum and Ethanol
🔵 Executive Summary The United States and Indonesia have finalized a Reciprocal Trade Agreement granting tariff-free access for US corn, sorghum, barley, grain co-products, and […]
Click here for more Sorghum Market News & Prices | Global Supply, Demand & Outlook
Interactive World Map of Global Sorghum Production
Please hover over a country to view its production figures.
Global Production Volumes in Recent Years
Please hover over a year to view the corresponding production figures.
Sorghum Production by Country and Share of Total Global Production
Production Volumes of the Three Largest Producing Countries
Please hover over a country to view the corresponding import volumes.
Import Volumes of the Largest Sorghum Importers
Please hover over a country to view the corresponding export volumes.
Export Volumes of the Largest Sorghum Exporters
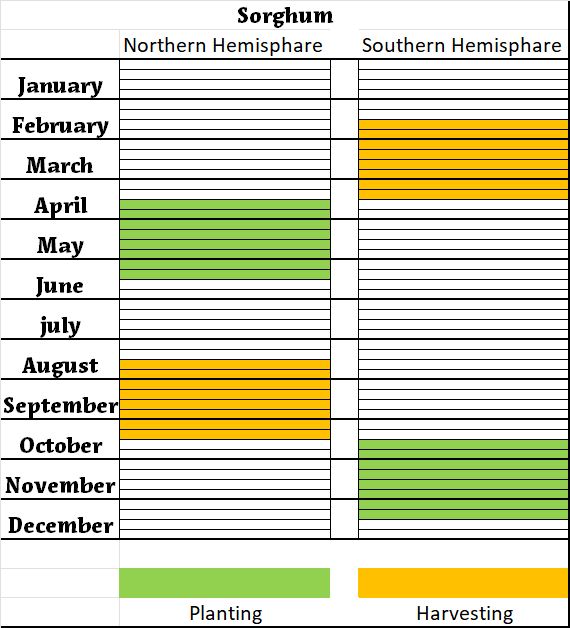
Planting and Harvest Periods of Sorghum
Price Charts
Please hover over a date to view the corresponding price point.