This page provides a comprehensive overview of the global Sugar cane market, combining production, trade, and price data in a clear and structured format. It features a world map illustrating the distribution of production volumes, charts showing total global output over the last twelve years, and the share of world production by country. Additional graphs highlight the production volumes of the three leading producer countries as well as the top 20 importing and exporting nations. A crop calendar outlines planting and harvest periods, while current price charts reflect recent market developments.
The page is designed for stakeholders in agricultural trading, processing, logistics, market analysis, and procurement. It answers key market questions related to global supply structures, trade flows, seasonal patterns, and price dynamics in the international Sugar cane market.
Latest Sugar Market News

Sugar Beet Market Gains Momentum: Active Futures and Rising Prices Signal Opportunity
The sugar beet market is entering a period of renewed activity and upward momentum, as highlighted by an impressive rally across the ICE Zucker Nr.5 […]

Bangladesh Sugarcane Plunge: Supply Risks, Farmer Dilemmas & Price Outlook
The sugar market is undergoing a significant transformation, particularly in Bangladesh's Rajshahi agricultural region, where the decline in sugarcane cultivation has sparked concern over long-term […]

Sugar Prices Surge on Oil Rally, But Global Surplus Looms: Insight & Outlook
The global sugar market is witnessing a fascinating tug-of-war between bullish short-term triggers and looming longer-term headwinds. In recent trading sessions, global sugar prices have […]
Click here for more Sugar Market News & Prices | Global Supply, Demand & Outlook
Interactive World Map of Global Sugar cane Production
Please hover over a country to view its production figures.
Global Production Volumes in Recent Years
Please hover over a year to view the corresponding production figures.
Sugar cane Production by Country and Share of Total Global Production
Production Volumes of the Three Largest Producing Countries
Please hover over a country to view the corresponding import volumes.
Import Volumes of the Largest Sugar Cane Importers
Please hover over a country to view the corresponding export volumes.
Export Volumes of the Largest Sugar Cane Exporters
Please hover over a country to view the corresponding export volumes.
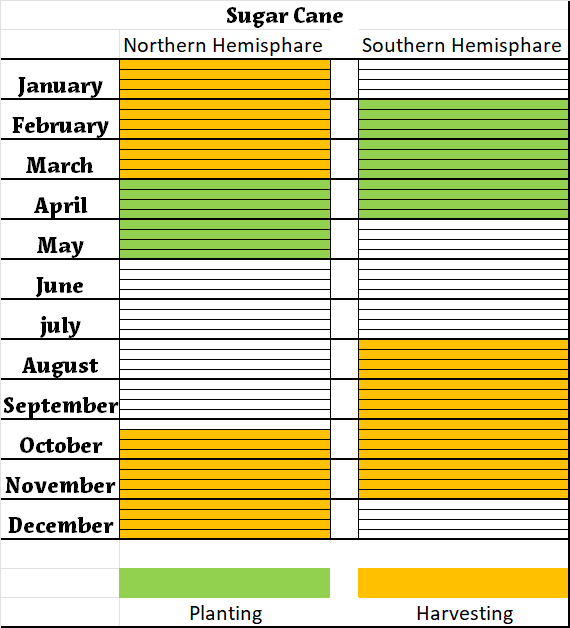
Planting and Harvest Periods of winter Sugar cane
Price Charts
Please hover over a date to view the corresponding price point.
Cane Sugar Production (2025)
| Country | Annual Production | Share of Total Sugar (%) |
|---|
| Brazil | ~44.7 million tons | ~100% (cane-only producer) |
| India | ~35.3 million tons | ~100% |
| Thailand | ~10.3 million tons | ~100% |
| China | ~10.4 million tons | ~90% |
| Australia | ~4.0 million tons | ~100% |
| USA | ~3.9 million tons | ~45% |